CHS
CHS Walsun Mall
Support

 Knowledge Base +
  2023.12.12
How does eye plan form a principle?
When observing transmission data signal with oscillograph, use the time signal of the system that be measured, outside passing oscillograph, spark or outside synchronism undertakes controlling to the scanning of oscillograph, because scanning cycle just is right now,be measured the integer of signal cycle times, what because this is on oscillograph fluorescent screen,observe is the stable graph that by many random symbols weaveform forms one jointly. This kind of graph looks as if eye, call the eye of digital signal to pursue. A whole eye picture should be included " 000 " to " 111 " all state group, following plan institute notify the procedure that 8 kinds of condition form a plan:
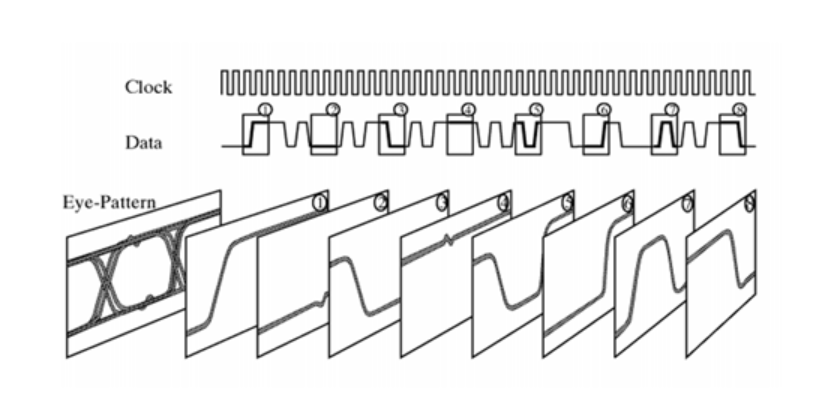
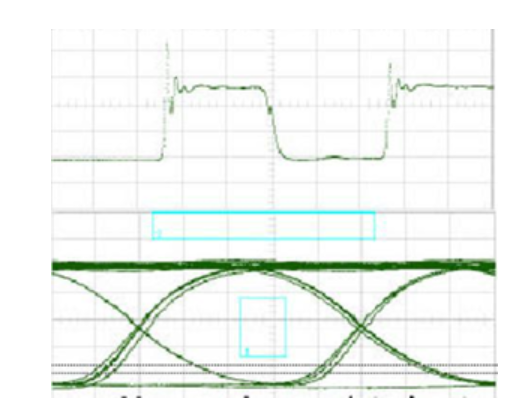
The signal that oscillograph measures commonly is a few or sometime paragraph undee, of more report is detail information, and eye graph is the figure that a series of number signal are accumulated on oscillograph and shows, it contained substantial information, can observe an effect that faze and noise string together between the code from eye graph, reflected the feature of digital signal whole, estimate rate of systematic actor bad thereby, the improvement that is whole system performance provides a basis.
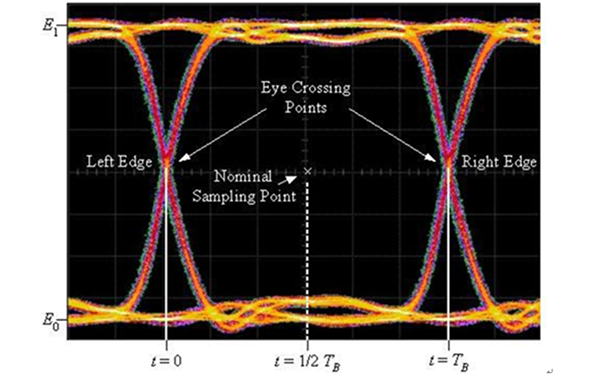
The structure that the eye pursues and parameter
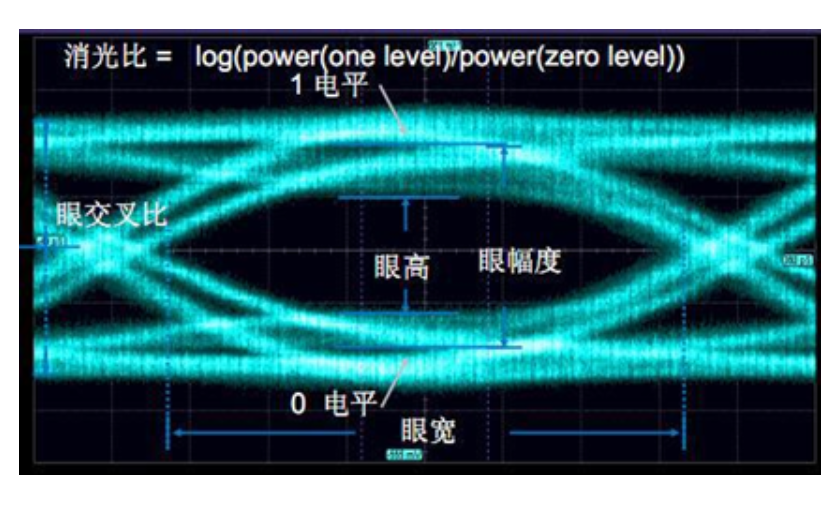
The parameter that the eye pursues has a lot of, like the eye across of extent of wide, eye, eye compares tall, eye, factor of extinction ratio, Q, average power, following plan institute show each parameter:
Following plan institute show each parameter:: Eye extent" express " 1 " n signal distributings with " 0 " the difference of n signal distributinging average, its are measured is through be in in the center of eye graph near the position area (leave to was apart from between alternate time at 0 o'clock normally 20% ) distributinging amplitude value undertakes.
Its are measured is through be in in the center of eye graph near the position area (leave to was apart from between alternate time at 0 o'clock normally 20% ) distributinging amplitude value undertakes.. The look is broad" those who reflect signal is total shake, it is a graph namely the volume that drives in horizontal axis place, its definition falls the point that collect for two upper edge and lower edge (Crossing Point) the time between is wrong.
Its definition falls the point that collect for two upper edge and lower edge (Crossing Point) the time between is wrong.. The key point is high" it is the volume that eye scheme drives in vertical axis place namely, it is to believe comparing of a confusion of voices to measure, very as similar as eye graph amplitude.
Detailed introduction is like a few complex concepts such as extinction ratio below, understand the function of a graph in order to help.
Extinction ratio
Extinction ratioIn defining the plan that it is an eye " 1 " n is compared " 0 " the value of n. The laser type with different rate, different transmission distance, different basis, extinction ratio requirement is different. Laser of general straight to FP/DFB attune asks extinction ratio is not less than 8.2dB. EML report absorbs laser extinction ratio to not be less than 10dB. A maximum did not set to extinction ratio in ITU-T, but it is OK that this does not imply extinction ratio infinity, extinction ratio is too high, the chatter coefficient that will bring about laser is too big, bring about passageway cost to exceed bid, go against Sunday run to transmit. Suggest actual extinction ratio and lowermost requirement extinction ratio are old commonly 0.5~1.5dB. This is not an implicit numerical value, give out so a numerical value is to fear extinction ratio is too high, signal deterioration is too fierce after transmitting, bring about pile up generation or passageway cost to exceed bid by accident.
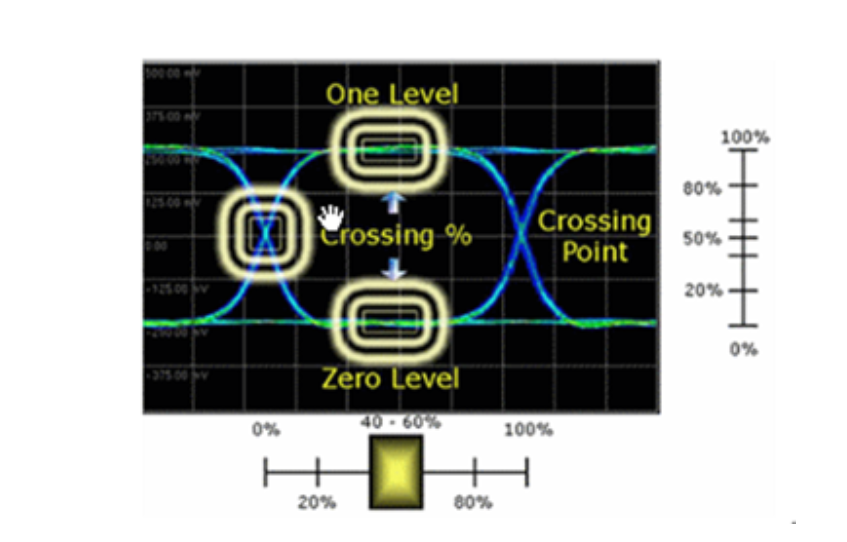
Eye across is compared
Crossing is the place of two eyes across, its scale reflected signal constitute sky comparing bulk. Because transmit a process in, the pulse width of smooth signal will spreading, bring about the crossing photograph that receives side to move to sending side to go up. Transmit to be helpful for Sunday run, the crossing scale that assures to receive side is in about 50% the left and right sides, make the sensitivity that admits side optimal, we suggest to be in commonly send side to leave the position of crossing a little move a few, send side crossing scale to suggest control is in commonly 40%~45% .
Q factor
Q factor can be measured through oscillograph, it reflects the quality problem of graph giving a look integratedly. Q factor has been jumped over higher, the quality that indicates an intention is better. Q factor gets noise, smooth power, telegraphic bugle call commonly whether from only then end matchs to terminal impedance (concerned impedance matchs, civil meeting defines after) wait for an element to affect. Generally speaking, the eye pursues medium " 1 " this line of n is finer, more flowing, q factor is higher. Below the condition that does not impose smooth attenuation, the Q factor that sends plan of side smooth eye should not is less than 12, had jumped over higher. Receive measured Q factor to should not be less than 6, had jumped over higher.
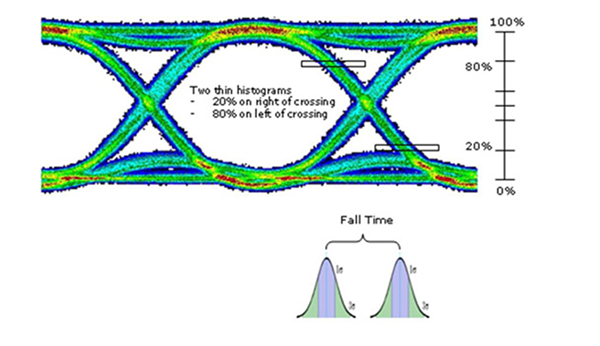
The rise time of signal, decay time
The rise time of signal, decay time reflected the rise of signal, descendent speed, point to the time of the change of the 20%~80% of whole signal extent commonly. Ask its rise commonly, 40% what decay time cannot be more than signal. If 9.95G signal asks,its rise, decay time is not more than 40ps.
Shake
Shaking is the time noise that piles up by accident is caused in transmission line of high speed data. If data rate of the system rises, shake in what measure inside a few seconds range will be general changeless, but when v/arc be on the throne is measured inside periodic a few time, it can become scale to rise as data rate, bring about then pile up by accident. Accordingly, in the system as far as possible reduce this to plant relevant shake, promote a system overall performance. The analysis shakes and its are specific generation reason will conduce to when the system is designed as far as possible reduce the effect that shakes movables to be born, can shake certainly at the same time the influence to BER, assure systematic BER under a certain maximum, it is normally. Accordingly, shaken formation the expression with direct cause pursues as follows:
Believe comparing of a confusion of voices
Letter a confusion of voices compares the quality stand or fall of signal of likewise OK and qualitative report, compare reference as. This measured value is bigger better, be more than 30dB in the measured value that sends side commonly. Measure need mensurably to use spectrometer.
Eye graph and systematic performance
In passing research and experiment to be able to pursue from the eye, reach whole ties the function case of all, we combine a picture frame to give out here the conclusion below.
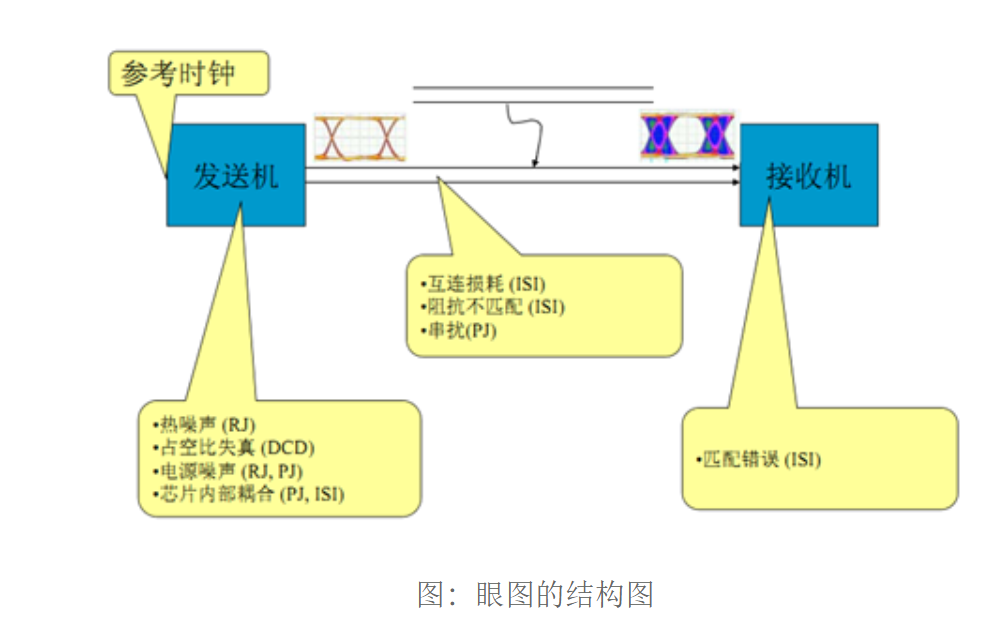
(1) optimal sampling hour should be " eye " open the biggest hour;
(2) the slope of eye graph bevel edge decided the system is time to sampling the acute degree of the error; Slope is bigger, acute to timing the error is jumped over;
(3) the distortion range that the perpendicular altimeter of the shadow region that the eye pursues shows signal;
(4) correspondence of position of cross axle of eye picture center is restricted at adjudicating the door n;
(5) over- lack fidelity at 0 o'clock the shadow length that goes up to be pressed in cross axle, the time standard of some receiver is the average position decision that adjudicates by the course the door is restricted to nod, pass so lack fidelity at 0 o'clock bigger, accurate to time mark extraction is more adverse.
(6) of the removed distance of the engrave when sampling, below two shadow region for noise tolerance, noise instantaneous value exceeds it to produce wrong court decision possibly.
Eye graph and pile up by accident rate
In digital circuit system, send end to transmit the data that gives many bit, as a result of the influence of a variety of elements, the bit that sink may admit a few errors (pile up by accident namely) . Of wrong bit number and total bit number pile up by accident than calling rate, namely Bit Error Ratio, abbreviation BER. The parameter with pile up leading is performance of system of descriptive number circuit the most important by accident. In the communication circuit system that leads in GHz bit (for instance Fibre Channel, PCIe, SONET, SATA) , normally requirement BER is less than or be equal to 10-12. Pile up by accident when rate is older, low, function does not stabilize the efficiency of communication system. The influence piles up the element of rate to include to shake by accident, the bit rate of the loss of noise, channel, signal.
In pile up by accident rate (BER) in the test, generator of pattern of sling-load can make bit of billions of data, give an input device these data bit hair, receive these data bit in output end next. Next, the data that piles up analyzer to will be received by accident and sent primitive data undertake contrast, decide what code admits an error, can give out for some time subsequently Neineiji calculates gotten BER. The consideration piles up the need that leads a test by accident, the real test eye of the face pursues under us for reference, in order to make BER plan, referenced eye graph is shown as follows:

BER graph is the function of BER(t) of place of appearance dot time, call BERT to sweep tracing or bath crock curve. In short, it is be in the photograph is given to referenced clock the BER that measures on the different time T of rated sampling time. Referenced clock can be signal catapult clock, also can be the clock that restores from inside reception signal, specific depend on the system of the test. With afore-mentioned eye the graph is reference, the eye stretchs degree with pile up the relation of rate and its BER graph to be as follows by accident:
Graph eye is stretched degree with pile up the relation of rate by accident
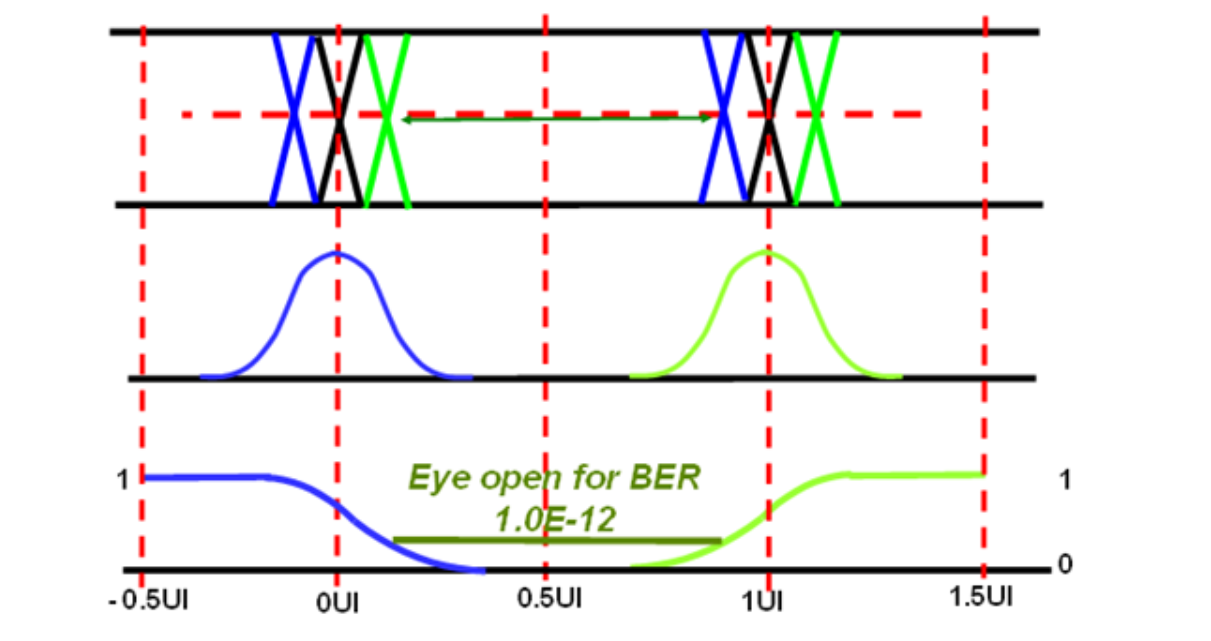
Graph BER(T) scanning or bath crock curve
In afore-mentioned two graphs, BER graph and axis of eye graph time are identical, two side and photograph of eye graph edge are corresponding, appearance dot is located in a center. When BER is certain, the distance between the curve is the eye graph on this BER opens rate. When appearance dot approachs point of intersection, shake can bring about BER to rise the biggest 0.5.
Subscribe to the newsletter
for all the latest updates.


2-5# Building, Tongfuyu Industrial Zone, Aiqun Road, Shiyan Street, Baoan District, Shenzhen. China