CHS
CHS Walsun Mall
Support

 Knowledge Base +
  2023.12.12
We live in time domain. This is the place that we measure all number performance. But sometimes, we can get the result quickly through bypass frequency domain. Adopt 6 principles, we can understand oscillograph how to measure time domain changeover to be frequency domain view. 6 kinds of all principles all by have fast Fourier to alternate (FFT) functional oscillograph " in engine the lid falls " application.
1、Spectrum is the combination of sine wave heft
In frequency domain, the weaveform that we can consider exclusively is sine wave. Still have other and special weaveform, its combination can describe any time domain weaveform, for example Hermite is Le Rangde multinomial, polynomial, small even, but the reason that wave of our winkle sine describes as frequency domain is sine wave be 2 rank, the solution of linear and differential equation -- these equation are in the circuit that involves resistor often appear, capacitor and inductance component. This is meant, when use sine wave is combined, with RLC circuit arises or the signal description of interaction compares any other functions simpler, because sine wave nature is met,happen.
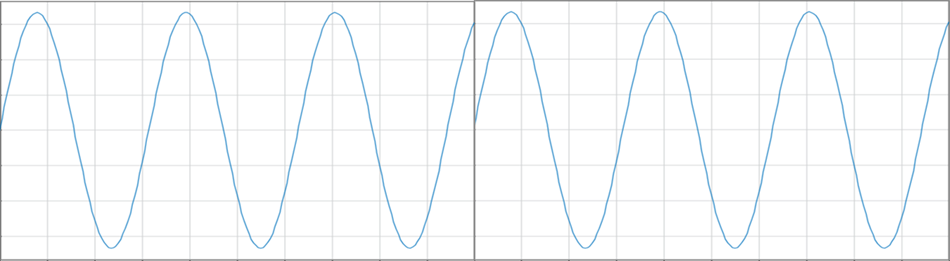
The sine wave that measures by oscillograph is collecting bumper (graph 1) in have <> time of 10 thousand voltage [V (T) ] several foothold, use 3 numbers to describe only in frequency domain: Frequency value, extent value and phasic value. This is pair of primitive and complex weaveform showing simplify.
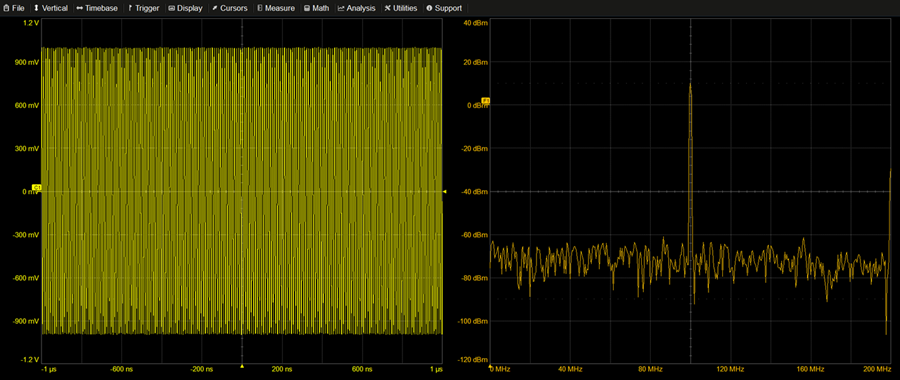
Graph 1. The 100 MHz sine in time domain affects the spectrum in its frequency domain indicated a peak value that 100 MHz manages.
2.Add weaveform indefinitely on oneself, found periodic weaveform
When we get weaveform in time domain and its changeover is frequency domain, we can get wave of a group of sine finally, every sine wave has a frequency a value, extent mixes phasic. In time domain, we will measure described as to have what always collect the time-interval 鈻?T between time T and example to collect buffer. Be in when us in frequency domain when the weaveform with same description, we will be all the gather of sine wave heft (every heft has frequency, extent and phasic) call spectrum.
Unfortunate is, we can be in only periodic V (T) disperse Fu Lixie is used to alternate on weaveform (DFT) . If it is not periodic, we must make it artificially periodic. We collect bumper to change the skill that is periodic weaveform with any random that will will measure data is the collection that gets total time T bumper, repeated it forever in the past, repeat it forever in the future.
Have weaveform of this kind of factitious reduplicative when us when, the power that we can use DFT comes the every frequency heft in mathematical computation spectrum. It is to use at computation below the extent of every frequency heft and phasic formula:
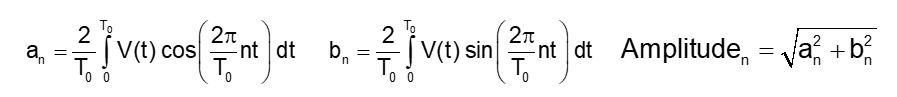
These integral found certain feature in spectrum.
3.Lowest of disperse frequency; appearing only in spectrum is essential
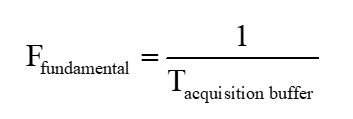
In calculative spectrum, show disperse frequency is worth only. Lowermost frequency heft is calledBase wave. It is we can put the wave of lowermost frequency sine that collects amortize time. The periodic P of wave of sine of this lowest frequency is to always collect time T.
Because P is equal to T, fundamental frequency is:
The frequency of the every frequency heft in spectrum is only base the integer of wave times:
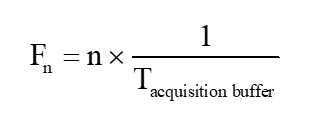
Base the multiple of wave is the exclusive frequency heft that we will see in spectrum. This is meant, the frequency interval between every frequency heft orResolutionIt is fundamental frequency. If we want higher resolution to come,closer frequency feature is lain between among chart of area scale down, we need to use longer collection in oscillograph time.
4. highest frequency is Nai Kui this special, or the half that sampling leads
The sampling in the highest frequency heft in spectrum and buffer nods the time-interval between to concern. At least, our need measures two V inside a cycle (T) the point will calculate the extent of this frequency heft and phasic value. It is OK that this means us calculative is highest double the cycle of frequency sine wave is time-interval, or T of 鈻?of Pmax = 2 X. 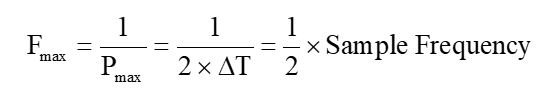
The highest frequency heft in spectrum also calls Nai Kui this special frequency. Because get the sampling of data to lead the Kui that it is Nai this special T of frequency 1/ 鈻?, accordingly we can be calculated the half that the highest frequency of sine wave heft is sampling rate. If sampling rate is 10 GS/s, criterion Nai Kui this special frequency is 5 GHz.
The average of ideal sine wave is from beginning to end 0. This is meant, use when us when wave of a group of sine will describe true weaveform, the average of the time domain weaveform that founds afresh is from beginning to end 0. But actual weaveform has average or shed deflection continuously. To solve this problem, we are dc heft memory in heft of 0 Hz frequency, this is wave of 0 X radical. In most oscillograph, you can restrain scale heft of 0 1000 frequency the scale with enlarge monitor.
5.FFT is 2^n through cutting off buffer above all sampling point will accelerate computational rate
Million data name a person for a particular job involves DFT computation about -727379968 times to found a spectrum. This may need longer than going to the lavatory time to calculate. To solve this problem, we use the faster version of the DFT that calls FFT. The integral with its computation and identical DFT, but it applies matrix maths to use bit of a total the power of 2 will carry out computation. If there are 20 thousand to nod in buffer, the largest check the number that can include in FFT computation is 19^524 = 288, <>Dot. We discarded almost the measurement of the half data, in order to win your person's incredible quick consideration time.
The first pace of executive FFT is the area that the definition collects buffer, this area is included will the 2^n of the largest amount nods calculative. The central area that most oscillograph allows you to choose time domain screen or from computation of left predestined relationship. Graph the area between the 2 dotted line that showed FFT computation lieutenant general includes.
 Graph 2. The area that collects buffer is between perpendicular dotted line, include the 2^n feature that will use in FFT among them.
Should collect amortize time to be S of 1 渭 , when and we have 10 thousand are nodded, we predict base wave for 1 MHz. In spectrum, FFT collects bumper to be less than this value, this means actual resolution to be more than < slightly>MHz. But, when considering spectrum feature, these estimation remain a very good value.
6.Window function can prevent the spectral leak that causes because of cutting off
To found periodic weaveform, we are used collect bumper and repeat it till the cows come home. When use FFT function, we were cut off further collect buffer, termless ground repeats interceptive buffer. This is meant add in every the attrib border place that collects bumper, the undee likelihood of the correspondence beginning at the ending of a bumper and next bumper is put in discontinuous sex (graph 3) .
Graph 3. Integer is done not have in collecting bumper give typical examples of periodic sine wave signal. When adding each other, the weaveform of every brim has bumper a discontinuous sex, offer by NI.
Normally, the spectrum of the sine wave that has integral periodicity in every bumper is in place of frequency of its peak value to will have individual frequency aiguille. But, if collect bumper and cut off sine wave artificially as a result of what cut off, the weaveform that grows indefinitely will have discontinuous sex now, this enters the heft of a few frequency in forcing peak value frequency the frequency heft of photograph adjacent, this may be brought about narrow peak value is lack fidelity.
This kind of effect is calledSpectral leak. Because value of the first voltage and the last voltage are worth the bogus shadow that differ and brings about bumper border to be in discontinuous sex,this is. The method that reduces this bogus shadow is to pass will whole collect buffer to multiply reduce discontinuous sex for the ground with window function bearer. This meeting collects bumper endmost voltage compulsively to be worth gradually for 0, the begin of the fag end that assures a bumper thereby and next bumper is successive.
Have a lot of commonly used window function. Their different point depends on the spectral leakage rate that they permit and the resolution that produce from this. Unless you have sufficient reason, otherwise we suggest you use Von Hann from beginning to end (call Hanning sometimes) or Blackman-Harris function.
The time domain in analysing frequency domain is undee
The spectrum that the value that spectrum analyses depends on can identifying heavy reply number " dactylogram " , its frequency is in base wave (1/ collects bumper) He Naikui this special (<>/<>X sampling is led) inside the limits between. Every time when oscillograph measures new time domain voltage to collect bumper, can show new calculative spectrum answer. As the source medium periodic signal produces change, their spectral dactylogram also can produce change.
Any likelihoods conduce to the application that identifies the periodic signal that gives frequency is analysis of real time spectrum is superexcellent await the person that choose. The commonnest application is the interference source that searchs important signal. Graph 4 indicated switch mode power supply (SMPS) the spectrum that outputs when laden change is answered. Peak value is 50 KHz about, switch frequency changes along with load and change along with time, if pursue,the spectrum plan institute of upside is shown. Of the noise that observes amplifier in these frequency heft when you or oscillator when shaking, you can know probable prime cause.
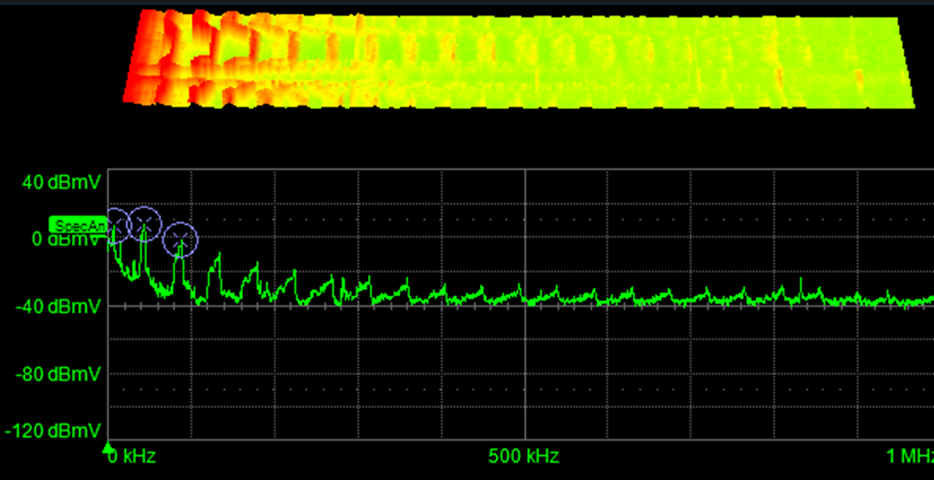 Graph 4. The give typical examples of real time spectrum that the SMPS when outputting laden change outputs, the time that showed peak value frequency varies.
When examining RF to disturb spectrum, we normally can the communication signal with specific collect. Graph the real time spectrum of course of the 5 power source in showing the device of USB power supply that uses the 10 times probe that contains means of big most advanced ring to measure. Spectrum dactylogram shows arrive from 87 MHz the FM radio frequency of 108 MHz paragraph pickup.

Graph 5. The real time spectrum of noise of metrical course of USB power source, the FM radio frequency of indication probe collect paragraph medium large heft.


Subscribe to the newsletter
for all the latest updates.


2-5# Building, Tongfuyu Industrial Zone, Aiqun Road, Shiyan Street, Baoan District, Shenzhen. China